Empowering Global Climate Action Using the World Emissions Clock
A data-driven tool to track global greenhouse gas emissions to the year 2050
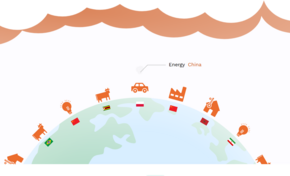
Imagine you could compare total and per-person greenhouse gas emissions or assess them by sector as easily as switching between tabs on your laptop. This is exactly what the World Emissions Clock (WEC) can do. Launched in 2022 through a collaboration between WU Vienna and World Data Lab, the Clock is a digital tool offering trustworthy, easy-to-compare data on emissions and climate change and was first presented at the UN Climate Conference COP27. Jesús Crespo Cuaresma and Lukas Vashold from the Department of Economics at WU led the development of the underlying statistical model that estimates future greenhouse gas emissions, assuming climate policies are left unchanged.
Emission pathways under different scenarios
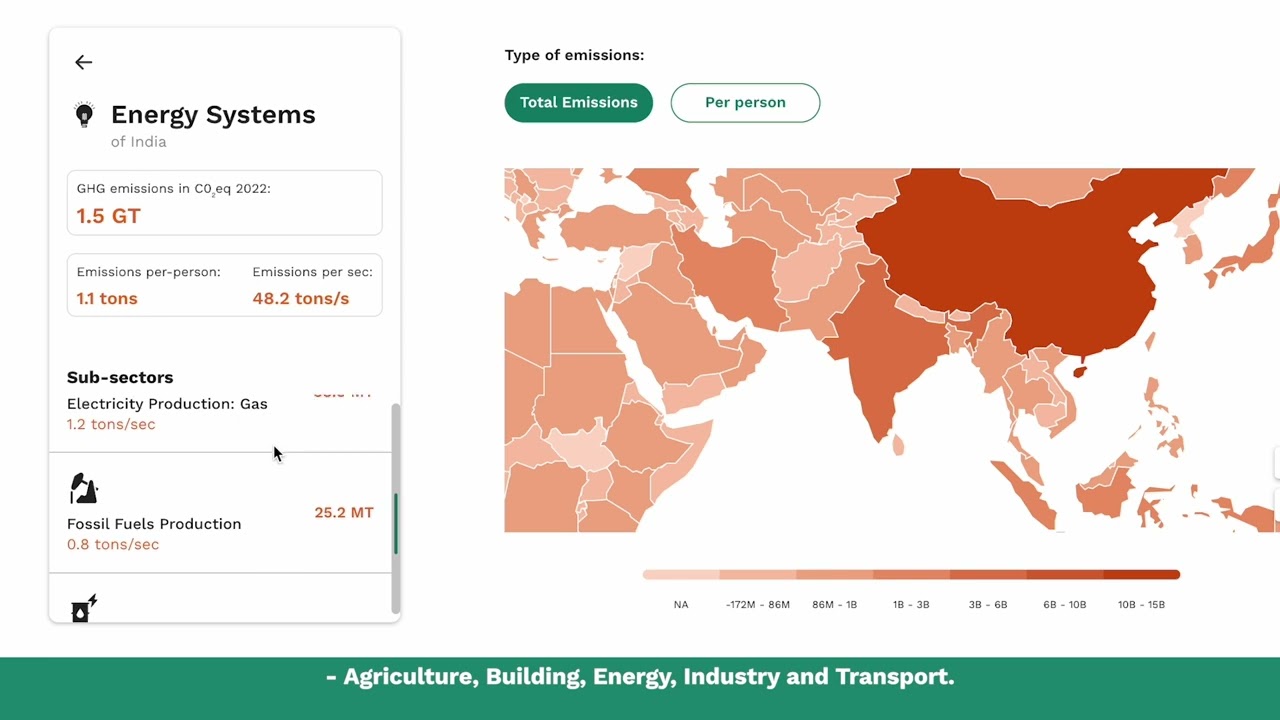
The Clock presents projected developments in greenhouse gas (GHG) emissions from 180 countries, five sectors (agriculture, buildings, energy, industry, and transport), and up to 24 subsectors until 2050. Its clever visualizing tools illustrate the following three possible scenarios for the future: business as usual, full implementation of nationally determined contributions (NDCs), and a 1.5 °C pathway.
● Business as usual – In this scenario, CO₂ emissions remain at current levels, putting the world on a path toward challenging climate impacts by 2050.
● Do as we promised – In this scenario, countries meet their current nationally determined contributions (NDCs) under the Paris Agreement.
● We achieve the goal – This is the most ambitious of the three scenarios. It reflects a pathway consistent with limiting global warming to 1.5 °C, as set out in the Paris Agreement, and requires substantially stronger emissions reductions than those currently pledged.
Currently, most countries are falling behind their commitments and need to raise their targets significantly.
Introducing the World Emissions…
Usage of the World Emissions Clock
Launched in 2022, the tool has been continuously used by climate scientists, organizations working to slow global warming, and policymakers focused on cutting greenhouse gas emissions. Users can view current and projected emissions across different sectors, and the tool allows easy comparison of total and per-person emissions across 180 countries worldwide. It also helps identify trends between developed and developing nations and supports the analysis of different approaches and policy outcomes implemented across the globe.
Professor Jesús Crespo Cuaresma from WU states that thanks to its design, the WEC is “one of the most powerful evidence-based tools available to assess the challenges of climate change mitigation worldwide.” A scientific article describing the modelling framework has been published in the scientific journal Communications Earth & Environment.
A glimmer of hope
The Clock’s wide coverage and consistent methods make it easy to compare countries and learn from each other, showing that a low‑carbon, prosperous future is possible without slowing economic growth. Emissions vary greatly worldwide, but by adopting best practices in areas such as transport, land use, and building insulation, especially in developed countries, carbon footprints could be significantly reduced. Existing technologies already enable economic growth while cutting emissions, making shared learning essential for a sustainable future. The Clock is also a valuable tool for governments and others to align policies with climate goals. Its creators shared the model with officials at the Austrian Ministry of Climate Action to support ongoing discussions and potential future steps.
Bringing together advanced model development and clear visualization in an interactive platform, the project delivers transparent emission projections that empower data‑driven decisions and ultimately promote evidence‑based climate policy around the world.
Key Facts
Department of Economics
WU staff: Jesus Crespo Cuaresma
Target Groups: Policymakers, NGOs, researchers, public
Cooperation Partners: World Data Lab (WDL), International Institute of Applied Systems Analysis
Funding Providers: eXplore! Project (B&C Stiftung und Michael Tojner), Federal Ministry of Economic Cooperation and Development of Germany (BMZ), the German Agency for International Cooperation (GIZ), the Patrick McGovern Foundation