Digital Collection "Wandtafeln Warenkunde und Mikroskopie"
WU’s digital collection of commodity science and microscopy wall charts consists of 20 different representations of microscopic renderings of plants used for starch, fibers, spices, and food.
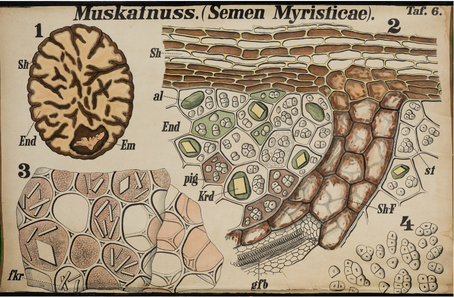
Chart 6, Nutmeg (Semen Myristicae)
The originals in the collection are stored in the WU University Archives. They were formerly owned by the technological institute of the University of World Trade, then by the institutes that succeeded it until 2012 (most recently the Institute for Technology and Sustainable Product Management).
The commodity science and microscopy wall charts were probably published in 1904. The charts were created by Prof. Dr. Karl Hassack (1861 to 1922), head of the Imperial Trade Academy (k. und k. Handelsakademie) in Graz. They were used to teach commodity science in higher educational institutes for business and commercial sciences, and were probably already used in commodity science courses at the Imperial Export Academy. All charts are approximately 65 cm high and 96 cm wide, and are stretched between two black lacquered wooden bars at the top and bottom. They are made of paper mounted on white linen. The digital reproductions of the charts were made by the WUtv team.
The collection is complete except for four charts and is listed in a 1956 directory[1] entitled “Wall Charts and Maps” compiled by Leopold Wenzel (1935 to 1973, university beadle, laboratory assistant, and later technical inspector at the technological institute) in a chapter entitled “Microscopy.” This directory also includes the missing charts “Wood of the common oak” (charts 22/23) and “Wood of the white fir” (chart 13). The directory does not mention chart 14, “Wood of the silver poplar, aspen”. The University Museum in Utrecht is in possession of a similar but less complete collection, including charts 13 and 14.
According to Wenzel’s directory, the collection was originally housed in room 75 of the university building on Franz Klein-Gasse 1 in Vienna’s 19th district. After WU moved to the Augasse location in the 9th district, some of the charts were hung on display in a room on one of the building’s basement levels, while others were stored away in cabinets in one of the institute’s storage rooms.
Currently housed in the University Archives, the “Commodity Science and Microscopy Wall Charts” collection is part of what remains of a once-larger collection formerly held by the Institute for Technology and Sustainable Product Management, which now consists of roughly 80 historic wall charts. Additional wall charts will be added to the collection as they are digitized.
The commodity science and microscopy wall charts were probably still used in a few selected courses until the 1980s.
Detailed knowledge of the anatomy of the most important plants used for starch, fibers, spices, and food was important for students of trade, to help them learn to identify counterfeits or wares of poor quality. These issues were particularly prevalent in times of hardship and shortages (during the First and Second World Wars and the interwar period). People with an education in business and trade worked, for example, as customs officials, in market supervision, or in legal departments, and were expected to have basic expertise in these areas. But even into the 1980s, the institute’s students still worked with microscopes, with the aim of helping students communicate better with technicians and scientists in the natural sciences. This direct engagement with real-world objects has been lost in business and economics education. Wall charts were used in teaching from the mid-19th century onwards and are an important source material for research on historical, image-based teaching media, which today cumulates in the use of digital media.[2]
[1] Wenzel’s typed directory can be viewed in the University Archives.
[2] Stöcker, Katrin (2018): Medialisiertes Vermittlungswissen, Heilbrunn