
#3 Blog: What did I do yesterday?
To assess the extent of paid as well as unpaid work and the division of labour in couple households, participants were asked to think about their own time use, as well as their partner’s time use of the previous day or the last working day. Participants indicated their time use by quarter-hourly intervals for pre-selected activity categories (sleeping, work, leisure, etc.). With the help of a random number PIN-code, we were able to link the partner responses of couples living in the same household if they both filled out the questionnaire (and agreed to be linked). A total of 82 heterosexual couples jointly took part in the survey, 38 of which were parents and 44 couples without children under 15 years of age. About two thirds of these couples completed the questionnaire on the same day.
Average time use according to self and partner’s estimates
The time estimates of the 82 couples allow us to compare the extent to which self and external reports of time use are consistent in these households. Table 1 shows the average time use for selected activities for women and men. On average, women spend about 2 hours less time on work-related activities (employment) than their partners. However, this is does not translate into more leisure time: The survey shows that men spend on average 30 minutes more time for hobbies, media use, sports, etc. than women. Interestingly, both men and women report that they spend on average 3 hours on household chores. However, the estimates provided by the partner reveals a more differentiated picture: men state that women spend around 3 ½ hours on housework, while women say that their partner spend only around 2 ½ hours on these activities. Thus, they both ultimately agree that women spend on average half an hour more on household work than men do. Men and women also agree on the share of childcare provided by women: while women spend on average around 6 hours (or 5 ½ hours according to their partner’s estimate) taking care of their children, men spend on average only half of that time (3 hours).
Table 1: Average time use by gender – self-assessment and external (partner’s) reference
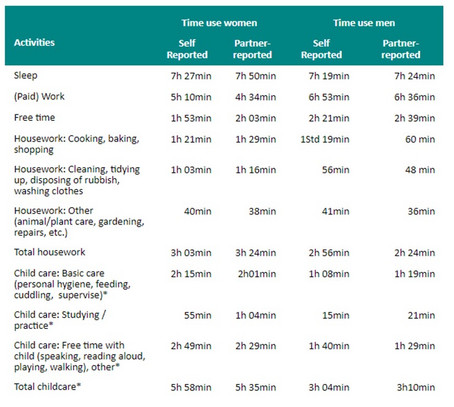
Note: *Childcare includes only couples’ households with children under 15 years old
Table 1 shows that the division of paid and unpaid work is unequal between men and women. Even during the COVID-19 lockdown, the larger share of unpaid work is done by women. However, the results show, that the time estimates vary depending on who is asked. Some results from these discrepancies are reported in the following section.
Difference between self and partner’s estimates
We calculated how accurately the respondents assessed their partner's time use. For instance: A person states that his or her partner spent 2 hours playing with their child. However, the partner himself/ herself only reported 1 ½ hours for this activity. The difference of more (less) than half an hour shows that the person overestimated (or underestimated) the partner's time use.
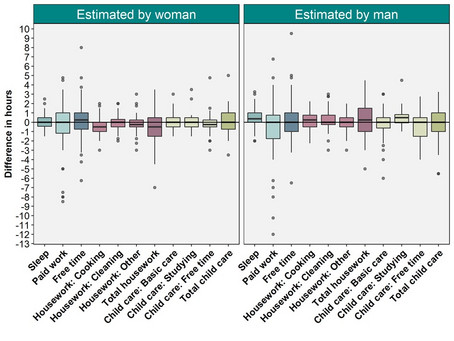
Figure 1 shows boxplots for the difference between self and partner’s estimates for selected activities. The median is shown as a bold line within the box. If the bold line is on the horizontal zero axis, the reported partner's time use is on average correct. If the median is below the zero line, women/men underestimate their partner's time; if it is above, they overestimate the time spent on a certain activity. The range of the box (interquartile distance) corresponds to the range in which the mean 50% of the data falls. Outliers are represented by the points below and above the box.
In the left chart of Figure 1 we see that women underestimate the average time their partners spend on housework by about half an hour. Similarly, the time fathers spend with their children playing, talking, etc. is underestimated by women by about 15 minutes. On the contrary, women state that their partners have 15 minutes more free time by day, than they actually do (self-report). Men, on the other hand, overestimate how long their partner sleep (by about 22 minutes), do housework (¼ hour) and study with their children (½ hour).
It is worth stating, that we do not know what the actual time use of our respondents is. The self-reported estimates can be as distorted as the information provided by the partner. There are various explanations for these discrepancies: social norms can lead men (but also women), who are convinced that a gender-equitable distribution of unpaid work is desirable, to adjust their response such that they come close to this ideal (overestimation of their own participation or that of their partner). It is also conceivable that the time needed for unpleasant activities, such as ``cleaning’’, may be overestimated by oneself, because the task feels longer than other more enjoyable activities do. A further potential source of bias is that partners often do not spend the whole day together and lack the knowledge of how the partner spent his day or how efficient she/he performs certain tasks (Kamo 2000).
Figure 1: Boxplots - estimates by woman and man
Conclusion
Linking the responses from 82 couples enabled us to investigate differences in perceptions about the partner's time use. Although the couples do not always agree on the actual time spent on different activities, there is conformity that housework and childcare are unequally distributed at the expense of women. For future time use surveys it would be of great interest to include a similar approach and also collect data about the participants partner's time use estimates. This would enable future research to investigate the structural gender discrepancies more closely for a larger and representative sample.
References
Kamo, Y. (2000). “He said, she said”: Assessing discrepancies in husbands' and wives' reports on the division of household labor. Social Science Research, 29(4), 459-476.